On Nov 07, 2016, at 05:00, Miroslav Lichvar <mlichvar@xxxxxxxxxx> wrote:
210 Number of sources = 7
MS Name/IP address Stratum Poll Reach LastRx Last sample
===============================================================================
^+ 192.168.230.240 1 2 377 3 -218ns[ -240ns] +/- 23us
^x 192.168.230.241 1 2 377 0 -40us[ -40us] +/- 2930us
^x 192.168.230.242 1 2 377 0 -40us[ -40us] +/- 2930us
^* 192.168.230.244 1 2 377 0 -146ns[ -168ns] +/- 23us
=x 192.168.230.1 2 3 377 1 -7027ns[-7049ns] +/- 1530us
=x 192.168.230.2 2 2 377 4 +4821ns[+4799ns] +/- 86us
=x 192.168.225.10 2 2 377 5 -24us[ -24us] +/- 206us
Hm, why are so many sources marked as falsetickers? Their measurements
look good.
All were marked as “noselect” except for the two NTP units under active test, 192.168.230.240 and 192.168.230.244. As to the others… 192.168.230.241 and 192.168.230.242 are commercial PTP/NTP units, but as you can see from the 2.93ms precision they have a firmware problem at the moment. The rest are general purpose computer systems. 192.168.230.1 is a FreeBSD system running ntpd. 192.168.225.10 is another chrony system, but is two switches and a firewall away (~160us).
Anyway, your results look much better than what I normally see, even
between machines connected directly without switch. Without HW
timestamping the std dev I see is at least few microseconds.
What HW and kernel do you use?
The general purpose computer systems are Intel SoC Atom (Rangeley) based with Intel igb nics. Nothing particularly special other than the number of nics. The monitoring system is this: http://store.netgate.com/ADI/RCC-VE-2440.aspx. The server is this: http://store.netgate.com/ADI/RCC-VE-4860.aspx Neither have locally GPS disciplined clocks (can’t be done with this hardware unfortunately). The kernels are Linux 4.4.26, configured for low latency. I’ll follow up with the list of kernel configuration parameters I use. Both the kernels and chrony are built with mtune=native.
The switch is a Cisco SG300-28. Again, nothing particularly special. A cut-through switch would show a little better, but I can’t justify it here—if needed, I test directly attached instead.
The two units under test, 192.168.230.240 and 192.168.230.244, were LeoNTP units: http://leontp.com. The Leo does not have an OS per se, but implements NTP as dedicated hardware/firmware. Very, very consistent.
Note that the monitoring system (where the graph data came from) is essentially doing nothing other than running Chrony. The server is quite busy in comparison, and this has a significant impact. For comparison, this is the view from the monitoring system (192.168.230.3):
210 Number of sources = 5MS Name/IP address Stratum Poll Reach LastRx Last sample===============================================================================^* 192.168.230.240 1 0 377 0 -1202ns[-1231ns] +/- 25us^- 192.168.230.244 1 0 377 0 +569ns[ +540ns] +/- 25us=x 192.168.230.1 2 3 377 1 -3050ns[-3079ns] +/- 1385us=x 192.168.230.2 2 1 377 1 +4778ns[+4778ns] +/- 87us=x 192.168.225.10 2 1 377 0 -25us[ -25us] +/- 183us210 Number of sources = 5Name/IP Address NP NR Span Frequency Freq Skew Offset Std Dev==============================================================================192.168.230.240 64 41 70 -0.000 0.006 -0ns 299ns192.168.230.244 64 36 72 -0.000 0.008 -43ns 386ns192.168.230.1 44 22 347 -0.021 0.018 -5406ns 3169ns192.168.230.2 31 17 62 -0.047 0.075 +1258ns 2220ns192.168.225.10 16 8 55 -0.026 0.300 -29us 3670ns
And this is the view from the server system (192.168.230.2):
210 Number of sources = 5MS Name/IP address Stratum Poll Reach LastRx Last sample===============================================================================^* 192.168.230.240 1 0 377 0 -1023ns[ -879ns] +/- 29us^x 192.168.230.244 1 0 377 0 -4914ns[-4914ns] +/- 33us=x 192.168.230.1 2 3 377 1 -10us[ -10us] +/- 1508us=x 192.168.230.3 2 1 377 1 -3532ns[-3390ns] +/- 85us=x 192.168.225.10 2 1 377 0 -45us[ -45us] +/- 201us210 Number of sources = 5Name/IP Address NP NR Span Frequency Freq Skew Offset Std Dev==============================================================================192.168.230.240 47 24 67 +0.000 0.033 +0ns 1304ns192.168.230.244 36 20 46 +0.019 0.055 -393ns 1213ns192.168.230.1 63 36 533 +0.002 0.015 -11us 5078ns192.168.230.3 18 6 36 +0.016 0.214 -2336ns 2693ns192.168.225.10 16 9 33 +0.268 0.746 -28us 8201ns
[NB: In the above only 192.168.230.240 has been marked as “trust”]
Here is what the graphs look like from the monitoring system. This is the view of the unit being synchronized to:
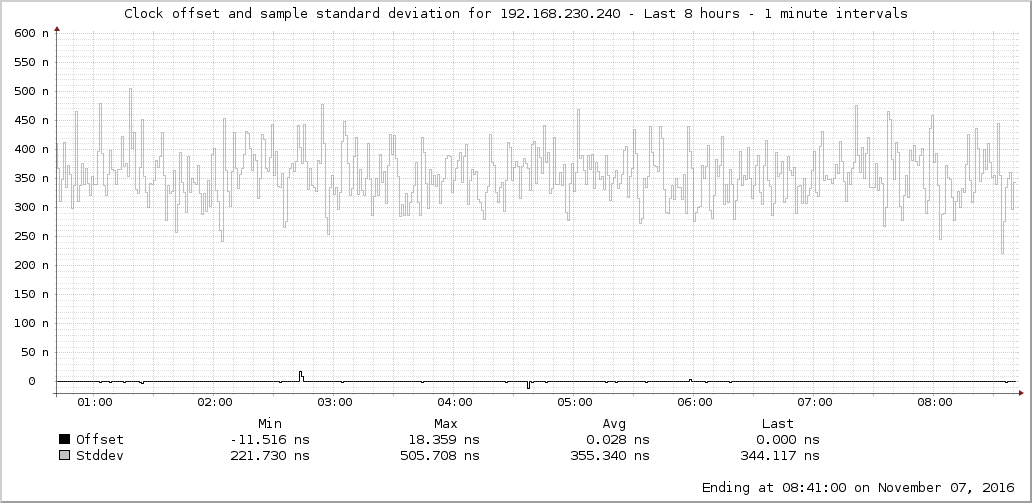
And with stddev removed to make the offset visible:
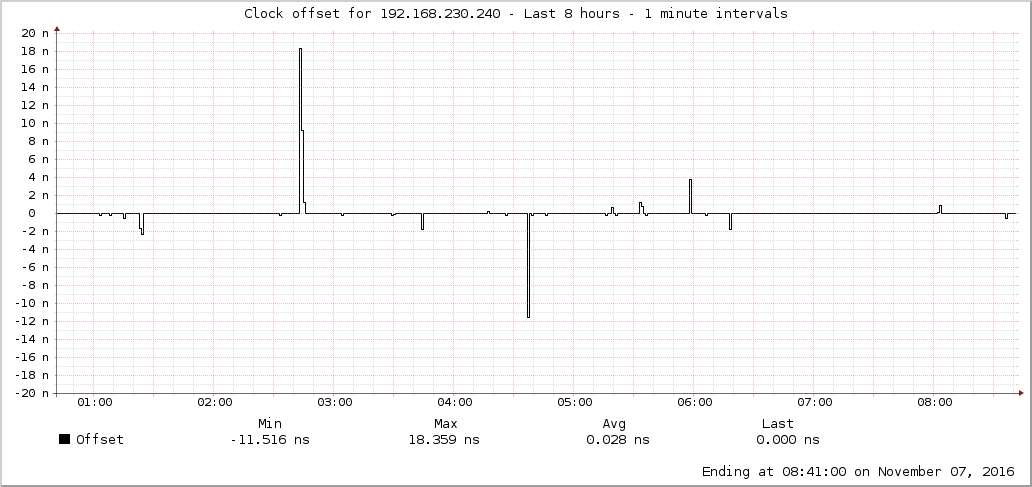
And lastly, this is the unit under test that is not being synchronized to:
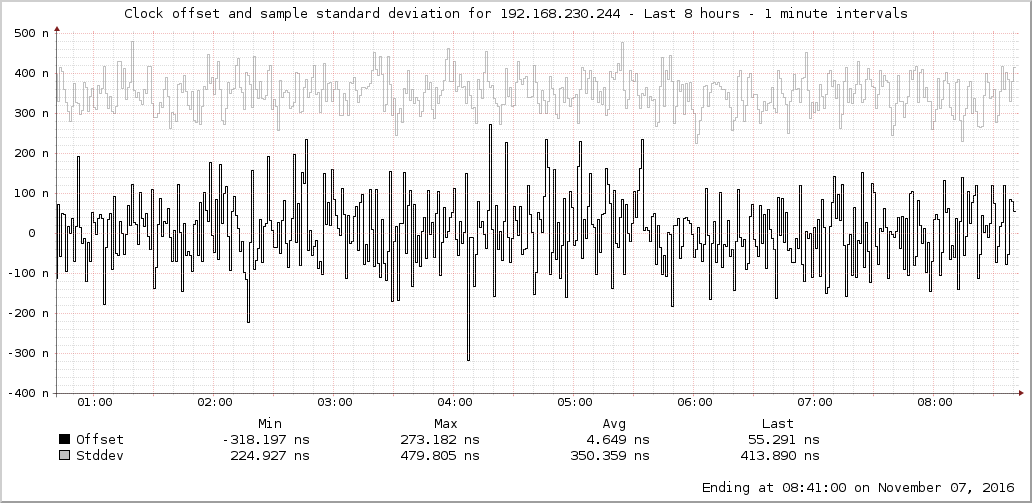
Pretty good at +-300ns. I’ve been very impressed with the LeoNTP units.
Denny